PROFILE. VISUALIZE. UNDERSTAND.

Quickly find performance bottlenecks and visualize what is going on in a complex C/C++ application.

ORBIT PROFILER

ORBIT PROFILER

Orbit is a standalone profiler and debugging tool for Windows and Linux. Its main purpose is to help developers understand and visualize the execution flow of a complex application. By giving a bird’s eye view of what is happening under the hood, Orbit gives the developer a deeper understanding of complex systems and allows to quickly find performance bottlenecks.
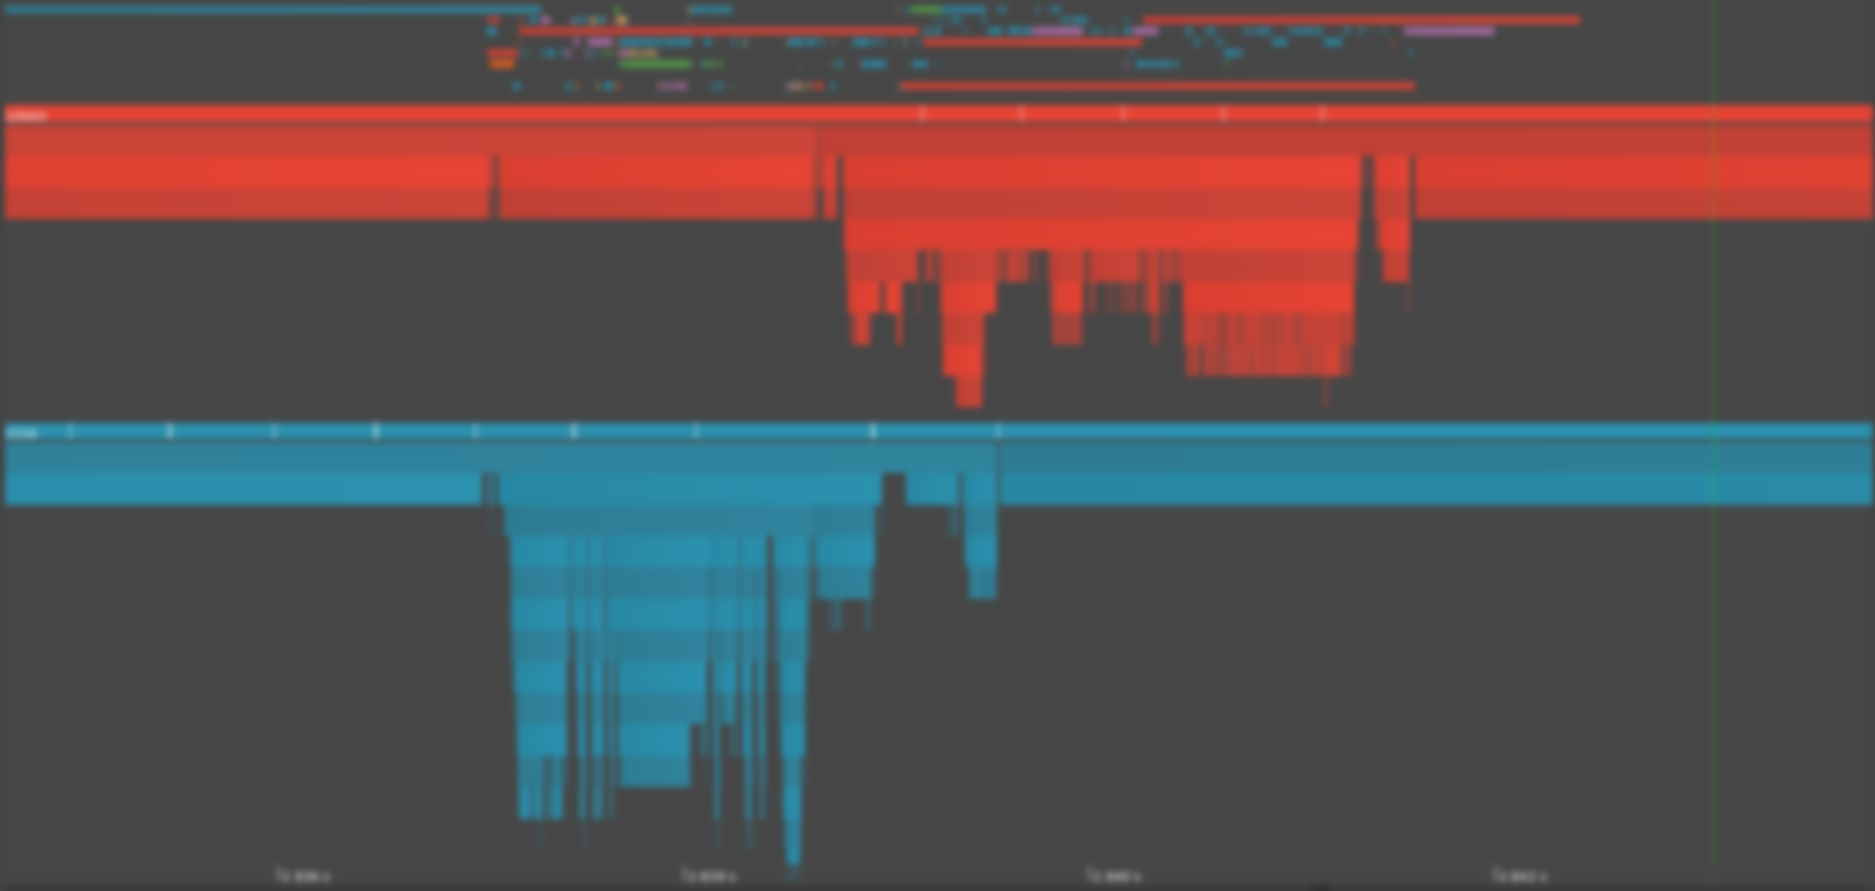

Features

Zero integration time

Orbit works out of the box on any C/C++ application, as long as it has access to the pdb file.  Start profiling as soon as you finish downloading Orbit.

Dynamic Instrumentation

Orbit injects itself into the target process and hooks into selected functions.  It works even on your highly optimized final/shipping builds.

"always on" sampling

Sampling is great when you don’t know where to start looking.  Orbit’s sampling is fast, robust and “always on”.